

Solar panels can be worth the investment: UK estimates put typical payback at 8-12 years, with the result shaped by how much electricity you use at home and how much you export. A solar panel return on investment calculator in the UK can help you estimate the balance between upfront system cost, bill savings and Smart Export Guarantee payments. The headline figure is only useful when it reflects your household, not just the panels’ potential output.
It’s reasonable to want a clearer picture before deciding. Savings vary with local sunshine, roof direction and shading, as well as when you use electricity. Using solar power as it is generated can reduce how much electricity you buy from the grid. Exported electricity may earn a separate payment, but you need to sign up to a Smart Export Guarantee tariff to receive it.
This guide explains how system size, household energy use, local solar generation and export rates affect a solar panel return on investment calculator in the UK. You’ll also see why calculator estimates are only a starting point and which details matter when assessing the likely long-term return for a UK home.
Key Takeaways
- Estimate payback by weighing installation cost against bill savings and export payments, rather than relying on a single headline return.
- Check how much solar electricity your household can use while it is being generated; daytime demand can make a meaningful difference to savings.
- Include your location, roof direction and shading when estimating annual output, as sunshine and roof conditions vary across the UK.
- Remember that SEG payments require you to sign up to a tariff, and rates can differ between suppliers.
- Use a calculator to explore likely returns, then consider how your home’s roof and energy-use patterns affect the estimate.
What is the Smart Export Guarantee (SEG)?
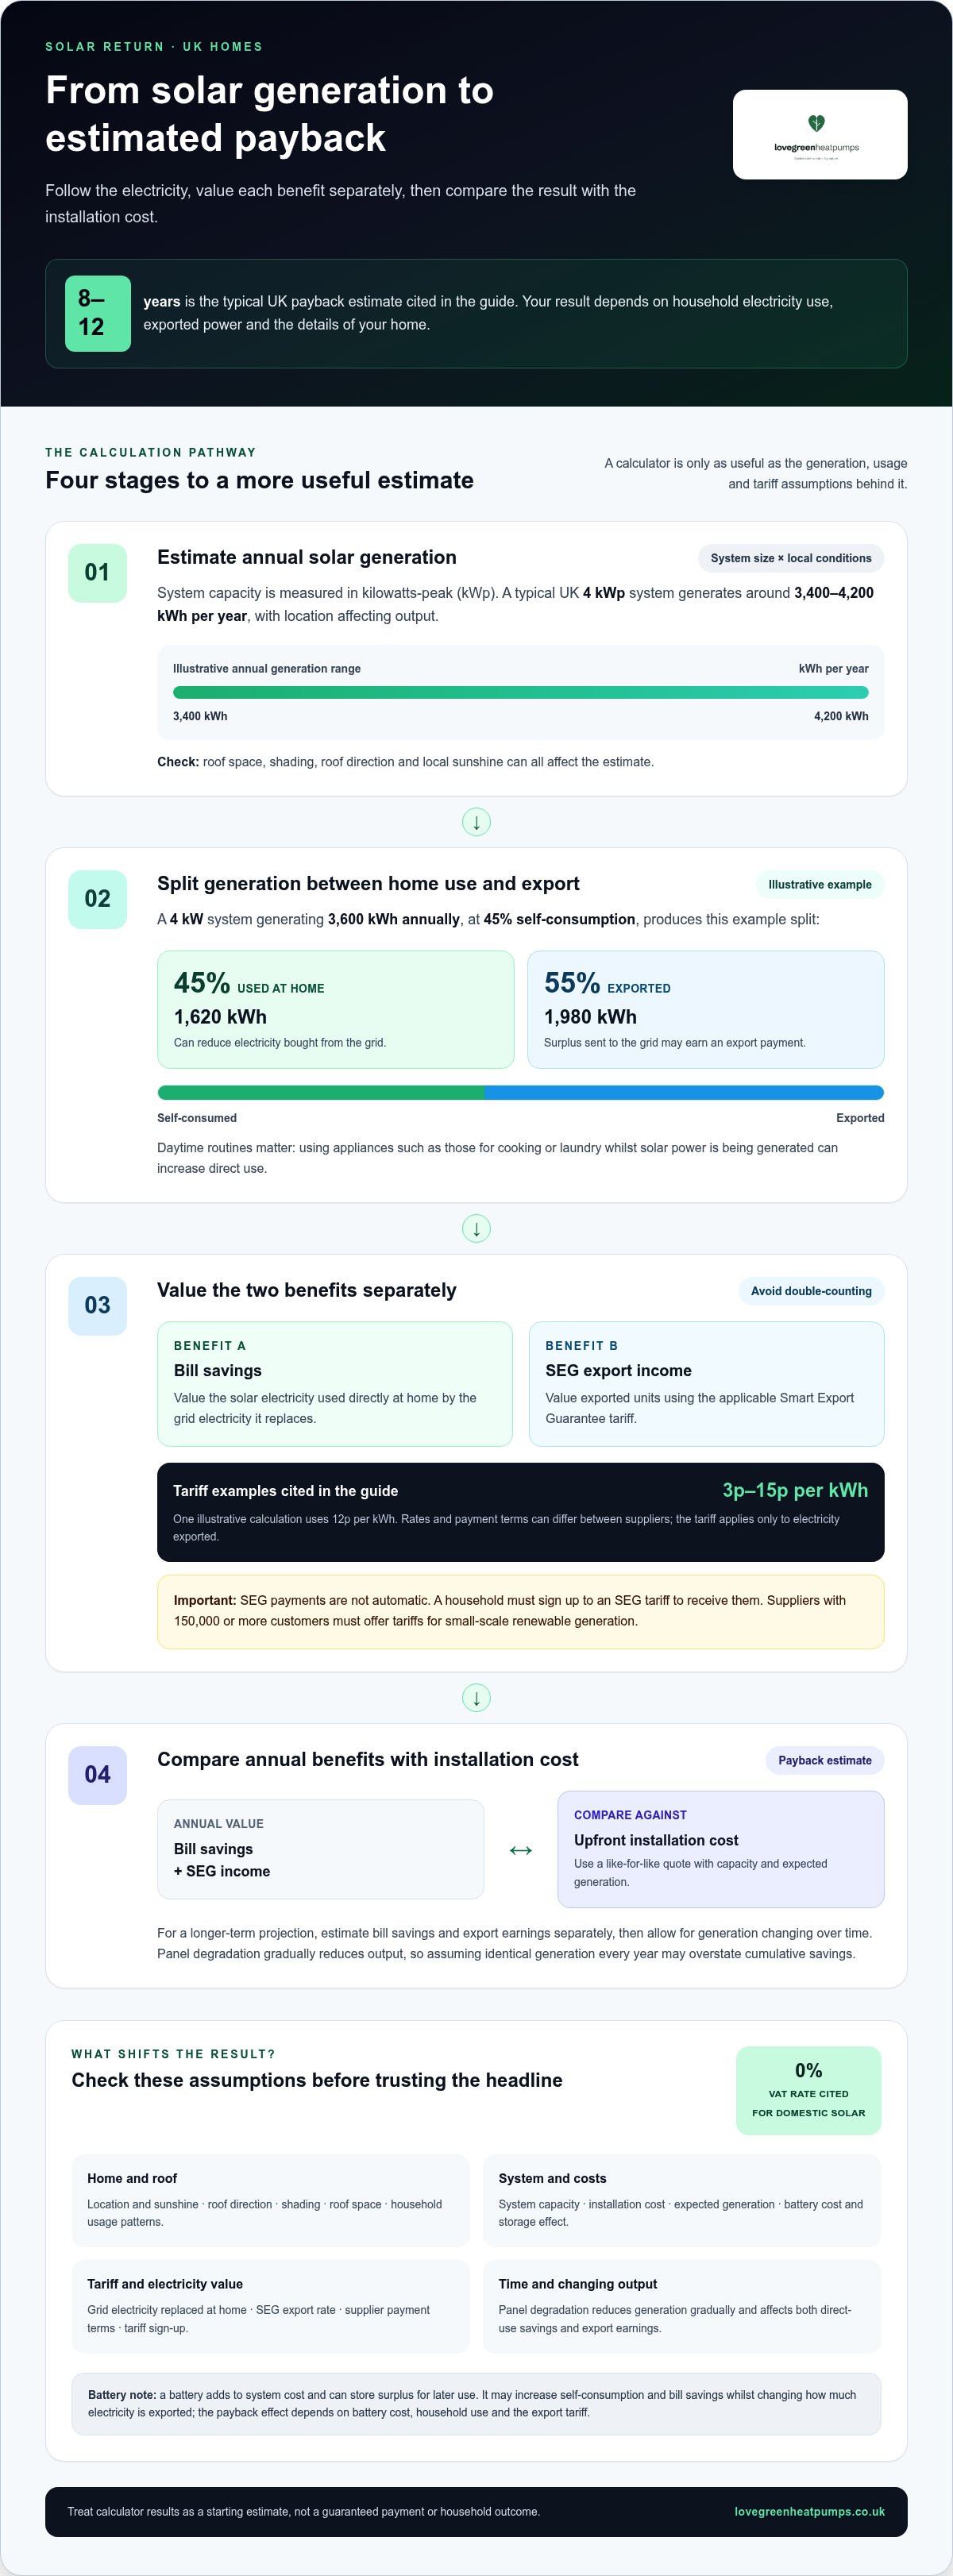
The Smart Export Guarantee (SEG) pays households for renewable electricity they export to the National Grid. Electricity suppliers with 150,000 or more customers must offer tariffs for small-scale renewable generation. A household must sign up to an SEG tariff to receive payments; joining isn’t automatic. The scheme can add income to a solar return, but payments apply to exported electricity, not power used directly at home.
Solar generation is split between self-consumption and export. Electricity used directly at home can reduce the amount you buy from the grid. Surplus generation flows to the grid and may earn an export payment. A battery can store some surplus for later, changing the balance between electricity used at home and electricity exported.
SEG tariffs vary between suppliers, so compare the rate and payment terms. Calculator descriptions give rates ranging from 3p to 15p per kWh, whilst one calculation uses 12p per kWh. The export tariff applies only to exported units. A higher rate may increase forecast income, but using solar electricity at home can also save money by replacing grid electricity.
Forecast the two benefits separately: first, value solar electricity used at home; then add SEG income from exported units. For an illustrative calculation, take a 4 kW system generating 3,600 kWh annually. At 45% self-consumption, 1,620 kWh is used at home and 1,980 kWh is exported.
This is an example, not a guaranteed payment. Actual savings depend on generation, household usage patterns and tariff rates. A calculator should show avoided grid purchases separately from SEG income, so it doesn’t count the same unit twice. It can also account for degradation, which gradually reduces generation and affects both self-consumption savings and export earnings.
Tax treatment affects the upfront comparison. According to HM Revenue & Customs, domestic solar installations in the UK have a 0% VAT rate. Include the applicable installation cost, estimated bill reduction and export income when assessing payback. Reviewing them together shows how SEG payments contribute to the overall return.
Estimated solar panel system size, cost and savings
System size affects annual generation, installation cost and the electricity available for household use. A useful estimate connects your roof’s capacity with your consumption patterns.
System Size, Cost and Generation
System size is the panels’ combined rated output, measured in kilowatts-peak (kWp). For UK homes, a typical 4 kWp system generates 3,400-4,200 kWh annually, depending on location. That range helps show why a calculator needs both system capacity and regional generation estimates. The right size also depends on roof space, shading and how much electricity your household uses.
Installed cost depends on system size and the property’s design requirements. Compare quotes on a like-for-like basis, including proposed capacity and expected annual generation. Running high-demand appliances, such as those used for cooking or laundry, during sunny periods can increase savings by replacing electricity bought from the grid.
A typical UK home solar system can generate 3,400-4,200 kWh per year from a 4 kWp installation, with location affecting output.
Solar’s return differs from a savings account: it mainly comes from reduced electricity bills and possible export income, rather than interest. Compared with other home improvements, its financial value depends on generation, household use and electricity prices, as well as practical benefits such as lower grid consumption.
Most domestic solar installations are permitted development and don’t need planning permission. Building regulations are separate: permitted-development status alone doesn’t establish whether an installation meets requirements for structural or electrical work.
A home battery adds to the system cost but stores surplus solar electricity for later use. It can increase self-consumption and bill savings while changing how much electricity is exported. Its effect on payback depends on the battery cost, household use and export tariff.
Long-Term Savings and Carbon Reductions
Long-term savings combine the value of electricity used at home with SEG income from exported units. This matters because annual generation and the share used at home shape the financial return.
For a 10-year projection, estimate annual bill savings and export earnings separately, then account for changing generation over time. Panel degradation reduces output gradually, so a forecast that assumes identical generation every year may overstate cumulative savings. Household routines and electricity prices also affect the comparison.
Solar can reduce household-related CO₂ emissions by replacing some grid electricity with power generated on the roof. The reduction depends on how much solar electricity the home uses, how much it exports and the emissions associated with grid electricity during the period assessed. Read a calculator’s carbon estimate alongside its energy assumptions, rather than as a guaranteed household outcome.
Use consistent assumptions when comparing system sizes. A larger system may generate more electricity, but savings depend on how much your home can use or export. Assess generation, installation cost and self-consumption together to understand likely payback and long-term value.
Household occupancy and self-consumption
Solar panels generate electricity during daylight, so household routines affect how much output is used directly. Self-consumption is the share of solar electricity used in the home rather than exported. Occupancy patterns help estimate that share, but appliance use and generation timing matter too.
Many UK homes use the most electricity in the morning and evening, while solar generation peaks during daylight. Someone working from home may run appliances as the panels generate. A household that is empty during the day may export more surplus electricity. These differences can change the value of the same system, even when annual output is identical.
Calculator assumptions provide a starting point. One estimate uses 30% self-consumption for a typical daytime-use household. Across UK homes without batteries, a typical range is 30-50% of solar generation. The remaining output is exported, subject to the household’s actual electricity use and system generation.
For a simple comparison, imagine a system generating 1,000 kWh. At 30% self-consumption, the home uses 300 kWh directly and exports 700 kWh. At 50%, it uses 500 kWh and exports 500 kWh. The higher self-consumption case avoids buying more electricity from the grid, while the lower case has more units available for an export tariff.
Occupancy is only part of the picture. A family at home during daylight may use a washing machine or dishwasher while the panels generate. Timers can shift some flexible appliance use into sunnier hours. By contrast, evening cooking and lighting often use electricity after generation has fallen. A useful estimate reflects when electricity is used, not just the annual total on your bills.
A battery stores surplus daytime electricity for later use. Typical UK homes with batteries may self-consume 60-80% of solar generation, compared with 30-50% without storage. Another estimate shows battery storage lifting self-consumption from 45% to 70-75%. The improvement depends on how much surplus is available and when household demand occurs.
Battery storage also changes the export calculation. Storing more electricity can mean fewer units exported and lower SEG income, while increasing the power available for evening use. Compare the value of extra self-consumption with the battery’s added cost when assessing payback. Don’t count stored solar electricity twice, once as bill savings and again as export earnings.
For a long-term forecast, apply the same household-use assumptions to expected generation across the system’s 25-year lifespan. Include gradual panel degradation, since falling output changes both direct consumption and exports. A realistic comparison tests different occupancy patterns, such as daytime use and an empty home, before relying on one projected return.
Postcode and regional sunshine data
Location affects solar output because sunshine and irradiance vary across the UK. Roof direction, pitch and shading also influence generation, so two homes with identical systems can have different returns. A postcode-based estimate combines local conditions with roof details to forecast electricity generation, bill savings and export income.
A UK calculator can estimate annual generation by multiplying system size in kWp by a location-specific MCS Kk value and a shading factor. MCS irradiance data divides the UK into 21 zones, with values covering different roof pitches and orientations. This makes postcode information more useful than applying one national average to every property.
The MCS Kk values use irradiance tables derived from the European Commission’s Climate-SAF PVGIS dataset. Calculators may also use Met Office sunshine data and MCS installation standards. Estimates based on MCS irradiance data are typically within 10-15% of actual yields, making them useful for comparing options rather than predicting each day’s output.
For south-facing UK roofs at a 30-35° pitch, MCS Kk values are typically 900-1,100 kWh/kWp, depending on region. An optimal south-facing system is estimated to generate 985 kWh/kWp. East- and west-facing roofs can also work well, depending on household energy use, but their output differs with orientation and local conditions.
South-facing roofs are generally favourable, but direction alone doesn’t determine a system’s value. Shading from trees or nearby buildings reduces the sunlight reaching panels. Roof condition, structure and available space also affect whether a proposed system suits the property. These details explain why a postcode estimate should be considered alongside the roof itself.
Property details make regional averages more useful. An Energy Performance Certificate (EPC) describes a home’s energy efficiency, while a roof assessment considers orientation, pitch, shade and usable area. EPC information adds household context, but cannot replace roof-specific details or postcode irradiance data.
Regional generation affects energy bills through the electricity a home can use directly. It also changes the surplus available for export under an SEG tariff. Compare estimates using the same system size, household consumption and export assumptions. Otherwise, a postcode comparison may reflect different inputs rather than sunshine alone.
Seasonal output matters too. A regional annual average combines brighter and duller periods, while household electricity use continues throughout the year. The inverter converts panel output into usable household electricity, and shading or roof layout can affect the system’s yield. For a sound return estimate, use postcode data alongside roof details and expected energy use.
Solar investment returns
Solar returns combine avoided electricity costs and export income over the system’s working life. UK estimates place typical payback at 8-12 years, while lifetime return depends on installation cost, generation, self-consumption and tariff assumptions. A useful comparison separates money saved on bills from SEG payments, then subtracts the initial investment and future costs.
Payback period is the time needed for cumulative savings and export earnings to match the installation cost. It isn’t the same as lifetime return: once payback is reached, later savings continue, but system upkeep and component replacement can affect the total. UK estimates put solar investment returns at 150-200% over 25 years, though individual results depend on the inputs used.
Be precise about the meaning of ROI. One example describes £200,000 in lifetime savings on a £100,000 initial investment as a 200% return over 25 years, with an annualised return of 4.5%. That example illustrates why lifetime and annualised percentages aren’t interchangeable. Check whether a calculator reports total savings, net gain or annualised return before comparing results.
Energy prices can shift the forecast substantially. Electricity used directly avoids buying that unit from the grid; exported solar energy earns the applicable tariff instead. A conservative analysis may use 2% annual energy price inflation, while a different assumption changes projected bill savings. Compare scenarios using the same system size, export rate, lifespan and inflation assumption for an accurate like-for-like result.
Include future costs as well as benefits. Solar panels gradually lose output through degradation, and an inverter may need replacing during the system’s life. A forecast that excludes these costs can show a shorter payback period than one allowing for maintenance and replacements. The effect depends on the equipment, expected output and costs included in the calculation.
A battery can increase the share of solar electricity used at home, but it adds to the initial investment. Its financial value depends on the extra bill savings compared with its cost, alongside any reduction in export income. Assess the battery separately from the panels so its costs and benefits don’t distort the solar-only comparison.
Support schemes also need careful treatment. The Boiler Upgrade Scheme provides grants towards heat pumps and biomass boilers, but doesn’t directly cover solar PV. Don’t include that grant as a solar return. Domestic solar installations have a 0% VAT rate according to HM Revenue & Customs, which affects the installation-cost calculation.
For a property-specific estimate, compare expected generation, self-consumption, export income, degradation and replacement costs across the same period. A qualified industry professional can provide tailored site-specific solar calculations. Discuss your solar PV installation with the relevant property and energy-use details in mind.
Love Green Heat Pumps: Heat Pump Installation
Love Green Heat Pumps Ltd can help turn your solar return estimate into a practical plan for solar PV at your property. This is a useful next step if you want to understand how system design, roof conditions and household electricity use shape expected generation and savings.
Love Green Heat Pumps Ltd provides solar PV and other renewable energy solutions, managing installation from design through to commissioning. You can also discuss how solar could fit alongside a heat pump installation if both are relevant to your home’s energy plans. A tailored quote gives you a project-specific basis for considering the investment.
For a considered assessment of solar PV for your home, contact Love Green Heat Pumps Ltd or visit lovegreenheatpumps.co.uk.
Make your next energy decision with confidence
A calculator is most useful as a planning tool, not just a final score. Use its estimate to decide what you want your home energy system to do: reduce reliance on grid electricity, make better use of daytime generation, or support a wider move towards renewable energy. Those priorities can guide the next conversation and keep the project focused on your household’s needs.
A solar panel return on investment calculator UK gives you a starting point. The next step is to match that estimate to your property, roof and practical plans. If you’re considering solar alongside other home improvements, a joined-up view can help you weigh the options without assuming one solution suits every home.
Love Green Heat Pumps Ltd offers solar PV and other renewables, heat pump installation and air conditioning. If you’re ready to discuss how solar could fit your home, talk through your solar PV plans. A clear, property-focused conversation can help you move from estimated returns towards a decision that feels right for your household.
Frequently Asked Questions
Are Solar Panels Worth It?
Solar panels can be worthwhile if your household can make good use of the electricity generated. A home occupied during daylight, or with flexible appliance use, may draw more solar power directly and buy less from the grid. Consider how long you expect to stay in the property, whether your roof is suitable and your likely daytime demand. These practical details help show whether the investment fits your plans.
Can I get grants or government incentives for solar in 2026?
The Boiler Upgrade Scheme provides grants towards heat pumps and biomass boilers, but does not directly cover solar PV. That distinction matters when comparing renewable options: don’t include a Boiler Upgrade Scheme grant in a solar-only payback calculation. Solar’s financial case instead rests on installation cost, electricity used at home and export income. Any grant assumptions should match the technology the scheme supports.
Can I use the tool if I live in Northern Ireland?
Yes, a UK solar calculator can be used to estimate generation for a Northern Ireland home. Use the property’s postcode and roof details where the tool requests them, since location and orientation affect the estimate. UK irradiance data is organised into 21 zones, with values for roof pitch and direction. The result gives a useful starting estimate for comparing system options and expected output.
How accurate are these calculations?
Solar yield estimates using MCS irradiance data are typically within 10-15% of actual yields. That makes them useful for planning, but a calculator still simplifies a real roof and household. Shading, roof orientation, system design and changes in electricity use can shift the result. Treat the projected annual generation as an estimate, and compare scenarios using consistent assumptions for energy prices and export tariffs.
What might limit the energy my panels can export?
A Distribution Network Operator (DNO) may limit a solar system’s export to protect the electricity grid from overload. That limit can affect how many units qualify for SEG payments, even when panels generate surplus electricity. Household consumption matters too: using solar power at home leaves less to export. A forecast should distinguish total generation, direct household use and exportable surplus.
How is solar panel payback calculated in the UK?
Payback is calculated by dividing the initial system cost by the annual financial benefit. That benefit combines avoided electricity purchases with SEG earnings, less relevant ongoing or replacement costs. A solar panel return on investment calculator in the UK can model those inputs over time. Check whether its result includes export income, maintenance and inverter replacement, so the payback estimate reflects the costs and benefits being compared.
What is the average UK cost of a 4kW solar panel system in 2026?
There isn’t one suitable average for every UK property: system design, roof specifications and battery storage affect the total. The price depends on the project and is provided after a quote request. For a useful comparison, assess the proposed system capacity, expected generation and whether storage is included. These details explain differences between estimates without treating unlike installations as equivalent.
What are current UK electricity prices and export rates for solar power?
Ofgem’s electricity unit rate used for Q2 2026 calculations is 24.67p/kWh. Export tariffs vary, with calculator descriptions placing SEG rates between 3p and 15p/kWh; one calculation uses 12p/kWh. These are separate rates: the import price informs the value of solar electricity used at home, while the export tariff applies to surplus sent to the grid. Check each assumption in a forecast.
Disclaimer
Disclaimer
The information published on this website is provided by Love Green Heat Pumps for general information and educational purposes. As a specialist provider of heating and renewable energy solutions, we strive to ensure that our content is accurate, relevant and up to date. However, heating requirements, system suitability, installation specifications, costs and performance can vary depending on individual property characteristics, usage and other site-specific factors.
Information provided in our articles should not be regarded as a substitute for a professional property assessment, technical survey or tailored recommendation. Any decisions regarding the selection, installation, replacement or maintenance of heating systems should be made with appropriate professional guidance.
Love Green Heat Pumps accepts no responsibility for decisions made solely on the basis of general information published in these articles. For advice specific to your property or project, we encourage you to contact our team for professional guidance and an assessment of your requirements.


